
Showing posts with label misc. Show all posts
Showing posts with label misc. Show all posts
Thursday, November 10, 2016
Update: Equation of States for US Presidential Elections
I modified the figure a little bit to show the two forbidden regions in the 2nd and 4th quadrants, which are violated twice in the past US presidential elections now.


Wednesday, November 9, 2016
Update: Equation of States for US Presidential Elections

Thursday, November 13, 2014
Ping-Pong Valence Sphere Model
Valence sphere models, a qualitative chemical bond model that includes the influence of the electron pair repulsion among valence electron pairs and attraction between positive atomic core and negative electron pairs, can be constructed with Ping-Pong balls easily. Here, I made three pairs of linked ping-pong balls and used them to create a tetrahedral sp3-hybridized AX4 system and a octahedral d2sp3 hybridized AX6 system.


Tuesday, January 21, 2014

Monday, January 13, 2014

Wednesday, January 8, 2014

Friday, January 3, 2014

Wednesday, January 2, 2013
Angry bird and other 3D bead models
A few 3D models I saw in Ying-Ge, New Taipei City (originally Taipei County) yesterday.
The bead model of angry bird is derived from C80 with some modification for its stomach.


The bead model of angry bird is derived from C80 with some modification for its stomach.


Thursday, November 8, 2012
Update: equation of states for election
I added one more point to my equation of states for election using the result of US 2012 presidential election.
 More explanation of this figure can be found in the previous post.
More explanation of this empirical relation can be found in the following draft a few years ago:


 I also designed a homework problem for a course on physical chemistry four years ago:


 The goal is to understand this empirical relation through the ensemble theory of statistical mechanics. Hopefully, students can have a better understanding between microstates and macrostates, and also the concept of equation of states.

More explanation of this empirical relation can be found in the following draft a few years ago:


Thursday, May 31, 2012

Thursday, May 3, 2012
Comments from Prof. Henry Bent
I mailed the reprint of my paper with Prof. Cuccia, "Molecular Modeling of Fullerenes with Beads" (J. Chem. Edu 2012 , 89 (3), 414–416) to Prof. Henry Bent two months ago. He is the person who proposed the tangent sphere model in the 60s.
He made the following comments on the beaded molecules:
"... contributions to the literature on molecular modeling such sophisticated molecules with so elegantly simple methods: beads and string, that's all!"
"The saturation and directional character of chemical affinity falls out naturally from your bead models without any need to refer, e.g., to Schrödinger's equation and atomic orbitals when constructing approximate electron density profiles, even for molecules as complicated as the fullerenes."
"... contributions to the literature on molecular modeling such sophisticated molecules with so elegantly simple methods: beads and string, that's all!"
"The saturation and directional character of chemical affinity falls out naturally from your bead models without any need to refer, e.g., to Schrödinger's equation and atomic orbitals when constructing approximate electron density profiles, even for molecules as complicated as the fullerenes."
Tuesday, April 24, 2012
Shing-Tung Yau's visit (丘成桐)
Famous mathematician, Shing-Tung Yau (Winner of Fields Medal 1982 and Wolf Prize in Mathematics 2010), and some of his friends (Prof. Mu-Tao Wang 王慕道, Math. Dept., Columbia university; Prof. I-Liang Chern, 陳宜良, Math. Dept., National Taiwan Unversity; another one I don't know) came to see the beadworks in our chemistry department yesterday morning. He seemed to enjoy these mathematical beadworks and asked me a few questions like whether these nontrivial structures have been really synthesized etc. ...
I told him I would feel honor to give him any model in the display case if he like it as a gift. He chose the bead model of P-type TPMS with (2,0).

I told him I would feel honor to give him any model in the display case if he like it as a gift. He chose the bead model of P-type TPMS with (2,0).

Tuesday, March 20, 2012
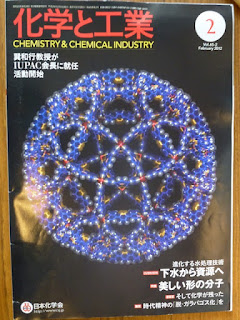
形狀美麗的分子(Chemistry & Chemical Industry, Vol. 62, 2012)
Prof. Sonoda (園田高明) of Kyushu University sent me a special issue on "Beautifully Shaped Molecules" of "Chemistry & Chemical Industry" published by Japanese Chemical Society. There are five articles by famous Japanese chemists in this issue. The photos I showed here are from an article on "Self-Assembled Polyhedra" (my translation based on the Kanji in the title, I don't know Japanese, though) by Makato Fujita (藤田 誠) of Tokyo University.


Tuesday, February 7, 2012
Cube kaleidoscope (Wonder Mirror Box, or CUMOS cubic cosmos scope)
N asked me about the cube kaleidoscope Chern posted before.
If you are interested in getting instructions and materials for making your own cube kaleidoscope, you should contact Prof. Takaaki Sonoda (園田 高明) of Kyushu University (九州大學). (reports about him in Czechish??? and in Japanese).
Here I just want to show the other two cube kaleidoscopes, kaleidostereochemistry and kaleidogarden, I made when Prof. Sonoda visited Taiwan about one year ago.


 It is really fun to make your own kaleidoscope.
Basically, one needs to have six mirrors to make a cube kaleidoscope. Once you have the necessary materials, you need to make patterns on two or three mirrors by scratching part of mirror away by using suitable stick. For details, please contact Prof. Sonoda.
It is really fun to make your own kaleidoscope.
Basically, one needs to have six mirrors to make a cube kaleidoscope. Once you have the necessary materials, you need to make patterns on two or three mirrors by scratching part of mirror away by using suitable stick. For details, please contact Prof. Sonoda.
 In addition to the two kaleidoscopes I made by myself, I also got another professionally made cube kaleidoscope from Prof. Sonoda as a gift.


 You can also find extra information at this site (CUMOS cubic cosmos scope). Here is one I found at that site:
 More images is in this
gallery.
More images is in this
gallery.
Here I just want to show the other two cube kaleidoscopes, kaleidostereochemistry and kaleidogarden, I made when Prof. Sonoda visited Taiwan about one year ago.


Sunday, January 15, 2012
Equations of States for Election (選舉狀態方程式)
(WARNING) This post has nothing to do with beading.
I still hope that some of you might be interested in the discussion.
At the beginning of the 2008 election year, the local Kuomintang (KMT) party of Taiwan had a landslide victory in parliamentary election by winning the 80% of the seat out of 58% of the total population votes. Here, I have recalculated the fractions of seats and votes based on the two-party approximation, i.e. I ignored all other votes except those voting for the two major parties, KMT and Democratic Progressive Party (DPP). The apparent disproportionation raises some puzzles on the fairness of the new electoral system just adopted for the election, in which only one representative get elected in a single district. However, this is very similar to the electoral system adopted by the US presidential election - winner of a state get all electoral votes of that state. So I guessed one might be able to see some empirical correlation from the US presidential elections of past one eighty years (1932-2004).
Figure 1 shows the relationship between the fractions of electoral votes vs. popular votes for US presidential elections since 1932 (Franklin D. Roosevelt won the election in that year.) Here x is defined as the fraction of popular votes obtained by republican's presidential candidate and y is defined as the fraction of electoral votes obtained by republican's presidential candidate. Interestingly, x and y are very similar to mole fractions commonly used in chemistry.
As an example from the US presidential election in 2000, Bush vs. Gore, we have popular votes: 50456002 (Republican) 50999897 (Democrat) and electoral votes : 271 (Republican), 266 (Democrat). Thus, in this case, x=0.497, y=271/(271+266)=0505.

The resulting data (blue circles in the figure) look like a titration curve, which can be fitted by y=tanh(ξ x) pretty well (blue curve). As a chemist, I deliberately write this curve in the form of the Henderson-Hasselbalch equation with an extra parameter ξ, denoting the cooperativity effect. There are fluctuations around the fitting curve, of course. That is the reason why G. W. Bush got elected, even though Gore had more popular votes in 2000. Additionally, this equation is symmetric, meaning that the electoral system is basically fair. But the fraction of seats of one party is a highly nonlinear function (close to a step function) of fraction of votes. The small parties are hard to get any seat in the parliament. Also, this equation does not say that we can predict the result either since we still need to know the fraction of votes, which is impossible to know before the election.
OK, all these data are already there before the 2008. What I found is that the 2008 re-election of legislative representatives of Taiwan fell pretty well on the same fitting curve or equation of states for a particular electoral system.
Later that year, in US presidential election, B. Obama got elected as the 44th president of United States by winning the 52% of popular votes and 67% electoral votes, which is again described by the election curve pretty well.
Now, we have a re-election of the legislative representative again in Taiwan yesterday (Jan. 14, 2012).
The results go like:
Fraction of total votes obtained by these two parties: (KMT: 48.18%; DPP: 43.8%)
Rescale the ratio by considering only these two parties: (KMT:52%; DPP: 48%)
Seats obtained by these two parties (KMT:44; DPP: 27)
Fraction of seats obtained by these two parties (KMT: 62%; DPP:38%)
This result satisfies the empirical equation of states for our electoral system pretty well. I consulted some local experts on election a few years ago. They told me this correlation is well known to them. However, the information I got from the media seems to contain so many details and is usually not very useful for getting a big picture. If this empirical relationship is valid, one might still need to provide a microscopic interpretation possibly based on some sort of statistical theory or ensemble theory that chemists and physicists commonly used for making connections between microscopic states and macroscopic properties.
slides of a talk I gave in Nov. 2008 right after US 2008 presidential election
此曲線的起源是
2008 年1月 臺灣 立委選舉改用「單一選區兩票制」,國民黨以 53.48% (僅考慮國 ,民兩黨,則為 58% 相對比例), 得到近八成的席次,很多人對此產生”不公”,或是「票票不等值」的疑慮。
我發現如果用美國過去八十年總統的總票數分率(橫軸)與選舉人席次分率(縱軸)做參考, 可以用一條類似滴定曲線來擬合(fiiting),我稱此為「單一選區兩票制」的「選舉狀態方程式」。"總得票分率"與"席次(選舉人)分率"兩個狀態變數並非獨立,而近似地滿足此「狀態方程式」。當然實際的選舉結果還是會在此方程式附近有微小擾動,否則2000年Al Gore 也就不會輸了!
這條曲線對中心點是對稱的,意味者選舉制度是公平的。但是選舉結果會放大贏的程度。
從2008年臺灣立委選舉開始,所有的選舉數據都是直接畫上去,並沒有進一步做任何擬合。
2008年底美國總統大選漂亮地落在這條曲線上。
昨天的區域立委結果分析如下:
(選票分率 國:48.18%;民43.8%)
只考慮此兩政黨,排出其它選票 (此兩黨的選票分率 國:52%;民48%)。
區率立委席次 (國:44; 民:27)此兩黨的席次分率(國:62%;民:38%)
兩黨席次分率對兩黨的選票分率滿足此「選舉狀態曲線」。
不分區的點則落在「比例代表制」的選舉直線上。
總結起來:臺灣的立委選舉採取了兩種選制,各有其選舉狀態方程式。
I still hope that some of you might be interested in the discussion.
At the beginning of the 2008 election year, the local Kuomintang (KMT) party of Taiwan had a landslide victory in parliamentary election by winning the 80% of the seat out of 58% of the total population votes. Here, I have recalculated the fractions of seats and votes based on the two-party approximation, i.e. I ignored all other votes except those voting for the two major parties, KMT and Democratic Progressive Party (DPP). The apparent disproportionation raises some puzzles on the fairness of the new electoral system just adopted for the election, in which only one representative get elected in a single district. However, this is very similar to the electoral system adopted by the US presidential election - winner of a state get all electoral votes of that state. So I guessed one might be able to see some empirical correlation from the US presidential elections of past one eighty years (1932-2004).
Figure 1 shows the relationship between the fractions of electoral votes vs. popular votes for US presidential elections since 1932 (Franklin D. Roosevelt won the election in that year.) Here x is defined as the fraction of popular votes obtained by republican's presidential candidate and y is defined as the fraction of electoral votes obtained by republican's presidential candidate. Interestingly, x and y are very similar to mole fractions commonly used in chemistry.
As an example from the US presidential election in 2000, Bush vs. Gore, we have popular votes: 50456002 (Republican) 50999897 (Democrat) and electoral votes : 271 (Republican), 266 (Democrat). Thus, in this case, x=0.497, y=271/(271+266)=0505.

The resulting data (blue circles in the figure) look like a titration curve, which can be fitted by y=tanh(ξ x) pretty well (blue curve). As a chemist, I deliberately write this curve in the form of the Henderson-Hasselbalch equation with an extra parameter ξ, denoting the cooperativity effect. There are fluctuations around the fitting curve, of course. That is the reason why G. W. Bush got elected, even though Gore had more popular votes in 2000. Additionally, this equation is symmetric, meaning that the electoral system is basically fair. But the fraction of seats of one party is a highly nonlinear function (close to a step function) of fraction of votes. The small parties are hard to get any seat in the parliament. Also, this equation does not say that we can predict the result either since we still need to know the fraction of votes, which is impossible to know before the election.
OK, all these data are already there before the 2008. What I found is that the 2008 re-election of legislative representatives of Taiwan fell pretty well on the same fitting curve or equation of states for a particular electoral system.
Later that year, in US presidential election, B. Obama got elected as the 44th president of United States by winning the 52% of popular votes and 67% electoral votes, which is again described by the election curve pretty well.
Now, we have a re-election of the legislative representative again in Taiwan yesterday (Jan. 14, 2012).
The results go like:
Fraction of total votes obtained by these two parties: (KMT: 48.18%; DPP: 43.8%)
Rescale the ratio by considering only these two parties: (KMT:52%; DPP: 48%)
Seats obtained by these two parties (KMT:44; DPP: 27)
Fraction of seats obtained by these two parties (KMT: 62%; DPP:38%)
This result satisfies the empirical equation of states for our electoral system pretty well. I consulted some local experts on election a few years ago. They told me this correlation is well known to them. However, the information I got from the media seems to contain so many details and is usually not very useful for getting a big picture. If this empirical relationship is valid, one might still need to provide a microscopic interpretation possibly based on some sort of statistical theory or ensemble theory that chemists and physicists commonly used for making connections between microscopic states and macroscopic properties.
slides of a talk I gave in Nov. 2008 right after US 2008 presidential election
此曲線的起源是
2008 年1月 臺灣 立委選舉改用「單一選區兩票制」,國民黨以 53.48% (僅考慮國 ,民兩黨,則為 58% 相對比例), 得到近八成的席次,很多人對此產生”不公”,或是「票票不等值」的疑慮。
我發現如果用美國過去八十年總統的總票數分率(橫軸)與選舉人席次分率(縱軸)做參考, 可以用一條類似滴定曲線來擬合(fiiting),我稱此為「單一選區兩票制」的「選舉狀態方程式」。"總得票分率"與"席次(選舉人)分率"兩個狀態變數並非獨立,而近似地滿足此「狀態方程式」。當然實際的選舉結果還是會在此方程式附近有微小擾動,否則2000年Al Gore 也就不會輸了!
這條曲線對中心點是對稱的,意味者選舉制度是公平的。但是選舉結果會放大贏的程度。
從2008年臺灣立委選舉開始,所有的選舉數據都是直接畫上去,並沒有進一步做任何擬合。
2008年底美國總統大選漂亮地落在這條曲線上。
昨天的區域立委結果分析如下:
(選票分率 國:48.18%;民43.8%)
只考慮此兩政黨,排出其它選票 (此兩黨的選票分率 國:52%;民48%)。
區率立委席次 (國:44; 民:27)此兩黨的席次分率(國:62%;民:38%)
兩黨席次分率對兩黨的選票分率滿足此「選舉狀態曲線」。
不分區的點則落在「比例代表制」的選舉直線上。
總結起來:臺灣的立委選舉採取了兩種選制,各有其選舉狀態方程式。
Monday, August 8, 2011
Buckyball made of 60 dodecadedra
I made this structure with beads last weekend. Still unfinished. The finished structure should have 60 dodecahedra arranged like a buckball. One has two ways to interpret this structure:
1. If every dodecahedron represents a carbon atom, we have a standard C60.
2. If we still use beads to represent CC bonds, then we have a giant molecule, C750. In this molecule, 450 carbon atoms are sp3 hybridized or tetra-valent and 300 atoms are sp2 hybridized or trivalent. But I suspect these sp2 hybridized carbon atoms are not energetically favorable, so it is better to have hydrogen atoms connected to these sp2-carbons. Then we get C750H300!

The bead model of this structure (see here) might be first constructed by Emilie. She asked me to comment about this structure in my blog long time ago (I couldn't find the exact location though).
I decided to make one from beads after I saw the same structure made by a toy designer, Dick Esterle, who actually invented this kind of toys, in the Bridges conference last week.


1. If every dodecahedron represents a carbon atom, we have a standard C60.
2. If we still use beads to represent CC bonds, then we have a giant molecule, C750. In this molecule, 450 carbon atoms are sp3 hybridized or tetra-valent and 300 atoms are sp2 hybridized or trivalent. But I suspect these sp2 hybridized carbon atoms are not energetically favorable, so it is better to have hydrogen atoms connected to these sp2-carbons. Then we get C750H300!

The bead model of this structure (see here) might be first constructed by Emilie. She asked me to comment about this structure in my blog long time ago (I couldn't find the exact location though).
I decided to make one from beads after I saw the same structure made by a toy designer, Dick Esterle, who actually invented this kind of toys, in the Bridges conference last week.


Friday, July 8, 2011
Carbon onion with zometool
We made a molecular model for the carbon onion consisting of six layers of concentric icosahedral fullerenes: C20, C80, C180, C320, C500, C720. This structure contains about 1820 balls and 2730 sticks. Some more extra sticks are used to connect different layers too.


Tuesday, June 7, 2011
HuangShan (Mountain Huang, or Yellow Mountain)
A few pictures I took on mountain Huang (黃山) in An-Hui province after a meeting on quantum chemistry held in He-Fei last week. Mountain Huang is arguably the most beautiful mountain in China and has often been the subject of Chinese paintings and poems.


On the top of the mountain, 光明頂(GuangMingDing), I found this geodesic dome. One can easily tell this is the C180 with Goldberg vector (3,0).


On the top of the mountain, 光明頂(GuangMingDing), I found this geodesic dome. One can easily tell this is the C180 with Goldberg vector (3,0).

Thursday, January 20, 2011
Hilbert's space filling curve
Chern showed me this bead model of Hilbert curve he made a few years ago when he was still an undergraduate student.


Wednesday, November 3, 2010
The Cubic Kaleidoscope I Made Today
Looking along the (1,1,1) direction:


Outside:

I gave it the name of "PlatoKaleido". Because this is in fact the three Platonic tilings, square planar(purple+red), equilateral triangular(orange+yellow) and honeycomb(green+blue) lattices, inter-penetrating one another orthogonally. The coloring is in accordance to the order of the spectrum of sunlight, if you notice. It is a great fun making this kind of kaleidoscopes, thanks to Prof. Takaaki from Kyushu University who kindly taught us earlier today.
My supervisor Bih-Yaw mentioned about the possibility of making this kind of kaleidoscope with other geometric shapes like triangular or pentagonal prisms. And Prof. Takaaki replied that they'd been trying everything possible already. However, I am thinking about using non-planar mirrors instead, e.g. concave or convex, making the "metric" of the wondering world therein non-Euclidean, maybe an interesting task. This is also related to some photos taken by Bih-Yaw at this year's Bridge conference. The artist made clever use of the curvature of the mirror, so the image of an seemingly unreasonable object on the mirror becomes a normal one (of course in this case the images are in fact the unreasonable structures that the artist tried to convey).


Outside:

I gave it the name of "PlatoKaleido". Because this is in fact the three Platonic tilings, square planar(purple+red), equilateral triangular(orange+yellow) and honeycomb(green+blue) lattices, inter-penetrating one another orthogonally. The coloring is in accordance to the order of the spectrum of sunlight, if you notice. It is a great fun making this kind of kaleidoscopes, thanks to Prof. Takaaki from Kyushu University who kindly taught us earlier today.
My supervisor Bih-Yaw mentioned about the possibility of making this kind of kaleidoscope with other geometric shapes like triangular or pentagonal prisms. And Prof. Takaaki replied that they'd been trying everything possible already. However, I am thinking about using non-planar mirrors instead, e.g. concave or convex, making the "metric" of the wondering world therein non-Euclidean, maybe an interesting task. This is also related to some photos taken by Bih-Yaw at this year's Bridge conference. The artist made clever use of the curvature of the mirror, so the image of an seemingly unreasonable object on the mirror becomes a normal one (of course in this case the images are in fact the unreasonable structures that the artist tried to convey).
Subscribe to:
Posts (Atom)